The Science Behind Color Response Mapping: From Nanometers to Predictive Models
At Engage Hill, we don’t just collect opinions — we measure authentic human reactions. But what does that actually mean scientifically? How do we turn a split-second color choice into reliable, predictive behavioral data?
This article pulls back the curtain on the science of Color Response Mapping (CRM) — the proprietary methodology that powers both MindsetView and Colormind.
Why Traditional Self-Report Tools Fall Short
Most surveys and assessments rely on language. They ask people to translate complex feelings, memories, and intuitions into words or numbers on a scale. This process introduces multiple layers of distortion:
- Cognitive processing and rationalization
- Social desirability bias
- Cultural and linguistic differences
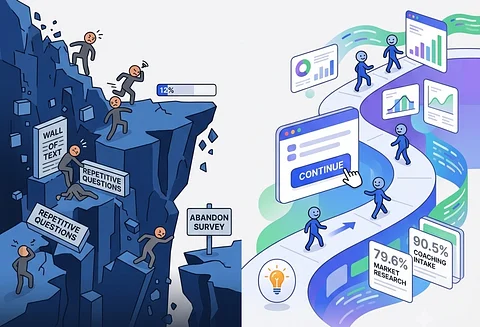
- Fatigue and survey abandonment
Even the best-designed questionnaires capture what people think they should say, not necessarily what they actually feel in the moment.
Color Response Mapping was engineered to bypass these limitations by working directly with how the human brain naturally processes information.
The Foundation: The Physics of Visual Perception
Human color vision begins with physics. When light hits the retina, specific wavelengths (measured in nanometers) trigger our cone cells. This process is incredibly fast — significantly faster than the prefrontal cortex’s language centers.
CRM leverages this biological reality. Instead of asking someone to rate “How much do you trust this brand?” on a 1–10 scale, we present stimuli (images, concepts, videos, or words) and capture their immediate, non-verbal response through a precise color selection interface.
Because the visible light spectrum is universal and consistent across human populations, this creates a standardized, bias-resistant data collection method that works across languages and cultures.
The Color Response Mapping Process
- Stimulus Presentation — A prompt or visual is shown.
- Instant Non-Verbal Response — The participant selects a color from the visible spectrum that best matches their immediate reaction.
- Mathematical Normalization — Individual baseline preferences and response patterns are calibrated and normalized to remove personal color biases.
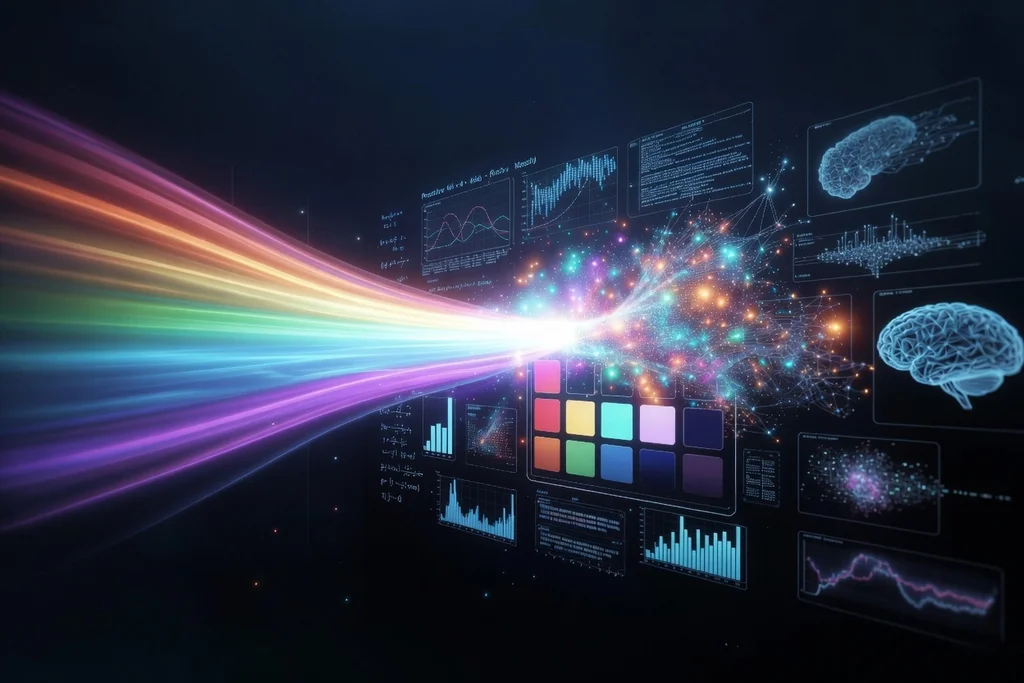
- Statistical Modeling — Raw color selections are transformed into structured data points using custom algorithms.
- Predictive Layer — These data points are fed into behavioral models that reveal patterns, mindsets, emotional resonance, and likely future behavior.
What the Research Shows
Independent validation research has demonstrated several important advantages of this approach compared to traditional questionnaires:
- Stronger capture of emotional responses: Physiological measurements showed that color-based responses aligned more closely with actual emotional arousal than verbal questionnaire answers. Questionnaires tended to reflect more rational, conscious attitudes, while the color method captured deeper, non-rational emotional signals.
- High temporal stability: Test-retest reliability over time was strong, particularly for the color-based method on certain dimensions.
- Complementary value: In many cases, color responses and questionnaire results showed moderate-to-strong correlation, but the color method often revealed insights that questionnaires missed — especially for abstract or emotionally charged stimuli that are difficult to articulate consciously.
These findings support the core premise: by working with the brain’s faster, more instinctive visual processing pathways, CRM accesses a different (and often richer) layer of human reaction.
From Raw Color Data to Predictive Models
The real power emerges in the analytical engines:
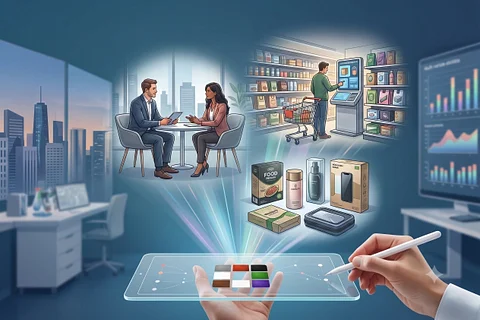
- MindsetView uses CRM to map individual mindsets, identify friction points in personal development, and track genuine progress over time for coaches and HR professionals.
- Colormind applies the same foundation at scale to measure authentic consumer emotional resonance, brand perception, and concept appeal for market researchers and brands.
Because the data is quantitative and normalized, we can build robust statistical models that predict real-world outcomes — whether that’s coaching success, behavioral change, purchase intent, or brand preference.
Why This Matters in 2026
In a world drowning in self-reported data and AI-generated content, organizations that can access clean, low-bias behavioral signals have a massive advantage. Color Response Mapping delivers exactly that: fast, engaging, cross-cultural, and scientifically grounded insights that traditional tools simply cannot match.
The result isn’t just higher completion rates (we regularly see 79–90%+ organic completion in real deployments). It’s higher quality data that leads to better decisions.
Ready to Experience It Yourself?
The best way to understand Color Response Mapping is to try it.
Start a Free MindsetView Assessment →
Explore Colormind for Brands →
Try our Data Collection Demo →
Want to discuss integrating CRM into your workflow? Book a 20-minute demo →